Introduction
Land-based human activities impact on coastal systems and a large fraction (41%) of the world ocean is strongly affected by multiple drivers [1]. Coastal areas of the Northwest Pacific region, China, Japan, Korea and Russian Fast East, are one of the mostly highly populated areas in the world, and the pressures and demands that this large population brings to bear on the environment are considerable [2]. One response to human activities in the ocean is the accelerated eutrophication caused by an increase in nutrient loading from farms and cities [3]. Eutrophication is indeed regarded as one of the major marine environment issues in the Northwest Pacific region [4], resulting in the occurrence of a significant number of red tides events [5] and a formation of a large-scale hypoxic condition [6]. Eutrophication can also become an environmental issue of a transboundary concern due to the abundance of giant jelly fish [7] and massive green tides [8] that are spread over wide areas by the movement of currents. Thus, to address these issues, it is necessary to engage neighboring countries in comprehensive and specific action to protect the shared environment.
Northwest Pacific Action Plan (NOWPAP) is a part of the Regional Sea Programmes of the United Nations Environment Programme (UNEP) which was adopted by the member countries, namely China, Japan, Korea and Russia in 1994. The geographical scope of NOWPAP covers the marine environment and coastal zones from about 121 to 143 degrees E longitude, and from approximately 33 to 52 degrees N latitude [2]. Within NOWPAP, four regional activity centers are established in each NOWPAP member country to carry out individual NOWPAP activities and projects approved by the Intergovernmental Meeting of the NOWPAP. Special Monitoring and Coastal Environment Assessment Regional Activity Centre (CEARAC) is hosted by the Northwest Pacific Region Environmental Cooperation Center (NPEC) in Toyama, Japan and CEARAC is mandated to develop tools for environmental monitoring using remote sensing techniques.
Following this mandate, CEARAC has been working for monitoring and assessment of eutrophication by combining available field data on water quality and ocean color remote sensing data [9, 10, 11, 12]. Among water quality parameters related to eutrophication, chlorophyll-a concentration (Chl-a), a proxy for phytoplankton biomass, is a useful indicator of eutrophication [13]. Within the NOWPAP,“Procedures for assessment ofeutrophication status including the evaluation of land-based sources ofnutrients for the NOWPAP region (NOWPAP Common Procedures)” were developed by CEARAC, and the use of satellite Chl-a to detect symptoms of eutrophication for identification of potential eutrophic zones is recommended [10, 12]. Satellite Chl-a is also proposed as an sub-indicator for Index of Coastal Eutrophication in the Sustainable Development Goal 14.1.1 of the UN Environment; however, methodologies on the use of Chl-aare still under discussion. As Chl-a can be observed from ocean color satellite sensors, many studies affirmed the temporal and spatial advantages of remote sensing for monitoring and assessing coastal zone water quality [14, 15]. Few studies have used both the level and the trend of remotely sensed Chl-a concentration (satellite Chl-a) for assessment of eutrophication [16] (Terauchi et al., 2014). Terauchi et al., [16] demonstrated the usefulness of applying both level and trend of satellite Chl-a in the assessment of eutrophication in Toyama Bay, Japan, and proposed a methodology to classify marine water into six eutrophication states: Low-Decreasing, Low-No trend, Low-Increasing, High-Decreasing, High-No trend and High-Increasing.
Maps of potential eutrophication zones in the NOWPAP region
Maps of potential eutrophic zones in the NOWPAP region can be viewed from the https://map.nowpap3.go.jp/maps/view. Methodology and materials used to map potential eutrophic zones can be found from this page.
Criteria to identify potential eutrophication zones in the NOWPAP
Potential eutrophic zones can be detected with the Screening Procedure of the refined NOWPAP Common Procedure. combination of three parameters are used: (1) trend of Chemical Oxygen Demand (COD) or Total Organic Carbon (TOC), (2) occurrences of red tide and hypoxia, and (3) remotely sensed chlorophyll-a concentration to identify potentially eutrophic zones in the NOWPAP sea area.
Visualization of each parameter and criteria for identification of potentially eutrophic zones
(1) Trend of COD or TOC
‘△’ on the map are COD monitoring stations. A long-term trend in annual mean of COD or TOC in regular monitoring sampling stations in the NOWPAP sea area is collected. Trend was detected by the Mann-Kendall and Sen’s Slope tests. The areas were marked and colored as: ‘I (red)’ showing increasing trend; ‘D (blue)’ showing decreasing trend; or ‘N (gray)’ showing no significant change. Then, the areas marked ‘I (red)’ were regarded as a symptom of eutrophication. The significance was examined at a 90 % confidence level.
(2) Occurrences of red tide and hypoxia
Areas of red tides with fishery damages are shown with ‘Icon A’ and without fishery damages are shown with ‘Icon B’ on the map. Exhausted fish images on the map indicate hypoxia. Detailed information of red tide occurrences are shown by different sizes of ‘○’ and the numbers, so that their spatial distribution can be understood.More than one event of red tide or hypoxia occurred in the recent three years in the target sea area was regarded as a symptom of eutrophication.
(3) Satellite derived Chlorophyll-a concentration (Chl-a)
Mean Chl-a level in the recent three years was calculated from the monthly mean of Chl-a level (1998-) in the NOWPAP region. 5 ug/L was set as a reference value, which is the low end of Middle of Chl-a criteria (5~20 μg/L) shown by Bricker et al. (2003). Then, The areas were divided into two categories, either ‘high status’ (exceeds 5 ug/L) or ‘low status’ (lower than 5μg/L). Next, the trend was derived from annual max values of each pixel since 1998 by using Sen’s Slope Test, and classified as either ‘Increase’, ‘Decrease’ or ‘No trend’.
This classification was combined with Chl-a level and trend then, again classified into one of six classifications: Low-Decreasing (LD); Low-No Trend (LN); Low-Increasing (LI); High-Decreasing (HD); High-No Trend (HN); or High-Increasing (HI). Classification of either HN or HI is regarded as a symptom of eutrophication.
Reference value was taken from the the low end of the medium Chl- a condition (5–20 mg m-3) of Bricker et al.(2003).
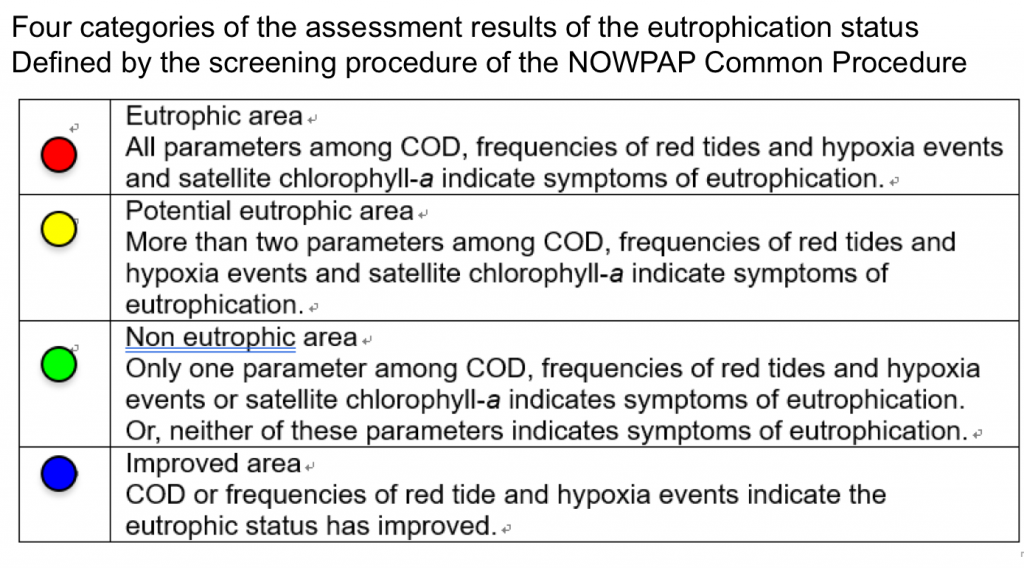
Identification of potential eutrophic zones
When all three parameters show symptoms of eutrophication, the area is classified as eutrophic area. Two among the three parameters shows symptoms of eutrophication, the areas is classified as potential eutrophic area. Only one among the three parameters shows symptoms of eutrophication, the area is classified as non eutrophic area. If COD or frequencies of red tide and hypoxia events indicate the eutrophic status has improved, the area is classified as improved area.
Meetings
Second CEARAC Expert Meeting on eutrophication assessment in the NOWPAP region (2019)
- Meeting minutes
- Presentation materials
A brief introduction of the meeting and self-introduction of participants
Genki Terauchi, NOWPAP CEARAC
Follow-up and review of SDG 14 through the Regional Seas programmes
Ning Liu, NOWPAP Regional Coordinating Unit, UN Environment
Introduction to NEAT : NOWPAP Eutrophication Assessment Tool
Genki Terauchi, NOWPAP CEARAC
Eutrophication Assessment on Potential eutrophic zones in China: Qinghuangdao Coast
Zhiming YU and Zaixing WU, Institute of Oceanology, Chinese Academy of Sciences
Assessment of Eutrophication in Potential Eutrophic Zones in Masan Bay
Seung Ho BAEK, Korea Institute of Ocean Science & Technology Risk Assessment Research Center
THE RESEARCH OF PHYTOPLANKTON ABUNDANCE IN THE SEA Äb0OF JAPAN (THE EAST SEA) BY A MATHEMATICAL MODELING WITH USE OF THE SATELLITE DATA
Alexandr Abakumov and Mr. Vasily Kachur, Laboratory of the Mathematical Modeling of Biophysical Processes, Institute of Automation and Control Processes, Far Eastern Branch of Russian Academy of Sciences
Assessment of eutrophication in potential eutrophic zones in Russia (Peter the Great Bay)
Vladimir Shulkin, Laboratory of Geochemistry, Pacific Geographical Institute, Far Eastern Branch of Russian Academy of Sciences
Toward the Management of Eutrophication of NOWPAP Sea Area: Monitoring by New Satellites and Modeling
Joji Ishizaka, Institute for Space-Earth Environmental Research, Nagoya University
Introduction to EcoQO activity and possible eutrophication
Dr. Osamu Matsuda ( POMRAC expert ) Professor Emeritus, Hiroshima University Vice-chair of International EMECS Center, Japan
Discussion note for setting NOWPAP Eutrophication target
Genki Terauchi, NOWPAP CEARAC
First CEARAC Expert Meeting on eutrophication assessment in the NOWPAP region (2017)
- Meeting minutes
- Presentation materials
Briefing of the activity on trial application of the screening procedure of the NOWPAP Common Procedure for eutrophication assessment
Genki Terauchi, NOWPAP CEARAC
Identification of eutrophic zones in the NOWPAP sea areas of China based on the Screening Procedure
Zhiming YU and Zaixing WU, Institute of Oceanology, Chinese Academy of Sciences
Trial application of the screening procedure of the NOWPAP Common Procedure to the NOWPAP sea areas in Japan
Genki Terauchi, Northwest Pacific Region Environmental Cooperation Center / NOWPAP CEARAC
Brief summary of potential eutrophic zones in Korea
Juyun Lee, Business Development Team, Korea Marine Environment Management Corporation
Trial application of the Screening procedure of the NOWPAP Common Procedure and WebGIS activity of CEARAC
Vladimir Shulkin, Laboratory of Geochemistry, Pacific Geographical Institute, Far Eastern Branch of Russian Academy of Sciences
Eutrophication and HAB
Yasuwo Fukuyo, Tokai University, University of Tokyo
Marine Eutrophication operational monitoring
Huo LUO, National Marine Environment Monitoring Centre, State Oceanic Administration
Revisions of NOWPAP Common Procedure for eutrophication assessment
- Procedures for assessment of eutrophication status including evaluation of land-based sources of nutrients for the NOWPAP region (Developed in June 2009)
- Procedures for assessment of eutrophication status including evaluation of land-based sources of nutrients for the NOWPAP region (Revision: 2013-Aug)
- Procedures for assessment of eutrophication status including evaluation of land-based sources of nutrients for the NOWPAP region (Revision: 2015-Feb)
Publications
- Integrated Report on Eutrophication Assessment in Selected Sea Areas in the NOWPAP Region: Evaluation of the NOWPAP Common Procedure(2011)
- A Case Study Report on Assessment of Eutrophication Status in Changjiang (Yangtze) River Estuary and its Adjacent Area, China(2011)
- A Case Study Report on Assessment of Eutrophication Status in Northwest Kyushu sea area, Japan(2011)
- A Case Study Report on Assessment of Eutrophication Status in Toyama Bay, Japan(2011)
- A Case Study Report on Assessment of Eutrophication Status in Jinhae Bay, Korea(2011)
- A Case Study Report on Assessment of Eutrophication Status in Peter the Great Bay, Russia(2011)
- Application of the NOWPAP Common Procedure for Eutrophication Assessment in Selected Sea Areas in the NOWPAP Region (2013)
- A Case Study Report on Assessment of Eutrophication Status in Jiaozhou Bay, China(2013)
- A Case Study Report on Assessment of Eutrophication Status in the North Kyushu Sea Area, Japan(2013)
- A Case Study Report on Assessment of Eutrophication Status in Toyama Bay, Japan(2013)
- A Case Study Report on Assessment of Eutrophication Status in Jinhae Bay, Republic of Korea(2013)
- A Case Study Report on Assessment of Eutrophication Status in Peter the Great Bay, Russia(2013)
Papers
- Terauchi G, Maure, E R, Yu Z, Wu Zaixing, Lee C, Kachur V, and Ishizaka J (2018) Assessment of eutrophication using remotely sensed chlorophyll-a in the Northwest Pacific region, Proc. of SPIE, 10778, Remote Sensing of the Open and Coastal Ocean and Inland Waters, 107780H; doi: 10.1117/12.2324641; https://doi.org/10.1117/12.2324641
- Terauchi G, Tsujimoto R, Ishizaka J and Nakata H (2014) Preliminary assessment of eutrophication by remotely sensed chlorophyll-ain Toyama Bay, the Sea of Japan Journal of Oceanography, 70(2), pp175-184. doi: 10.1007/s10872-014-0222-z
List of experts involved in CEARAC eutrophication assessment activities
Dr. Zhiming YU
Professor
Chinese Academy of Science
Institute of Oceanology, China
Dr. Zaixing WU
Professor
Chinese Academy of Science
Institute of Oceanology, China
Dr. Yasuo Fukuyo
Professor Emiritus
University of Tokyo
Dr. Joji Ishizaka
Professor
Institute for Space-Earth Environmental Research,
Nagoya University
Dr. Osamu Matsuda
Professor Emiritus
Hiroshima University
Dr. Genki Terauchi
Senior Researcher
Research & Study Department
Northwest Pacific Region Environmental
Cooperation Center
Dr. Chang-kyu LEE
Senior Scientist
Fishery and Ocean Information Division
National Fisheries Research and Development Institute, Korea
Dr. Seung Ho BAEK
Principal Researcher
Risk Assessment Research Center,
Korea Institute of Ocean Science & Technology , Korea
Dr. Pavel Tishchenko
Leader Scientist of Hydrochemistry Loboratory,
Department of the Ocean Geochemistry and Ecology,
V.I. II’ichev Pacific Oceanological Institute,
Far Eastern Branch of the Russian Academy of Sciences, Russia
Dr. Vladimir Shulkin
Head
Laboratory of Geochemistry,
Pacific Geographical Institute,
Far Eastern Branch of Russian Academy of Sciences, Russia
References
[1] Halpern, B., Walbridge, S., Selkoe, K., Kappel, C., Micheli, F., D’Agrosa, C., Bruno, J., Casey, K., Ebert, C., Fox, H., Fujita, R., Heinemann, D., Lenihan, H., Madin, E., Perry, M., Selig, E., Spalding, M., Steneck, R. and Watson, R., “A Global Map of Human Impact on Marine Ecosystems,” Science 319(5865), 948–952 (2008).
[2] UNEP, “Action Plan for the protection, management and development of the marine and coastal environment of the Northwest Pacific region” NOWPAP Publication No. 1 (1997).
[3] Carpenter, SR, Caraco, NF, Correll, DL, Howarth, RW, Sharpley, AN and Smith, VH., “NONPOINT POLLUTION OF SURFACE WATERS WITH PHOSPHORUS AND NITROGEN,” Ecological Applications 8(3), 559 – 568 (1998).
[4] Shulkin, V.M. and Kachur, A.N. (eds), “State of the Marine Environment Reportfor the NOWPAP region,” POMRAC. 141 p, (2014).
[5] NOWPAP CEARAC, “Integrated Report on Harmful Algal Blooms for the NOWPAP Region,”(2011).
[6] Wei, H., He, Y., Li, Q., Liu, Z. and Wang, H., “Summer hypoxia adjacent to the Changjiang Estuary,” Journal of Marine Systems 67(3-4), 292–303 (2007).
[7] Xu, Y., Ishizaka, J., Yamaguchi, H., Siswanto, E. and Wang, S., “Relationships of interannual variability in SST and phytoplankton blooms with giant jellyfish (Nemopilema nomurai) outbreaks in the Yellow Sea and East China Sea,” J Oceanogr 69(5), 511–526 (2013).
[8] Liu, D., Keesing, J. K., Dong, Z., Zhen, Y., Di, B., Shi, Y., Fearns, P. and Shi, P., “Recurrence of the world’s largest green-tide in 2009 in Yellow Sea, China: Porphyra yezoensis aquaculture rafts confirmed as nursery for macroalgal blooms,” Marine Pollution Bulletin 60(9), 1423 – 1432 (2010).
[9] NOWPAP CEARAC, “Eutrophication Monitoring Guidelines by Remote Sensing for the NOWPAP Region,”(2007).
[10] NOWPAP CEARAC, “Procedures for assessment of eutrophication status including evaluation of land-based sources of nutrients for the NOWPAP region,”(2009).
[11] NOWPAP CEARAC, “Integrated Report on Eutrophication Assessment in Selected Sea Areas in the NOWPAP Region: Evaluation of the NOWPAP Common Procedure,”(2011).
[12] NOWPAP CEARAC, “Application of the NOWPAP Common Procedure for Eutrophication Assessment in Selected Sea Areas in the NOWPAP Region,”(2014).
[13] Harding, LW. Jr. and Perry, ES., “Long-term increase of phytoplankton biomass in Chesapeake Bay,” Mar Ecol Prog Ser 157, 39–52(1997).
[14] Kitsiou, D. and Karydis, M., “Coastal marine eutrophication assessment: A review on data analysis,” Environment International 37(4), 778 – 801 (2011).
[15] Klemas, V., “Remote Sensing Techniques for Studying Coastal Ecosystems: An Overview,” Journal of Coastal Research, 2 – 17 (2011).
[16] Terauchi, G., Tsujimoto, R., Ishizaka, J., and Nakata, H. “R Preliminary assessment of eutrophication by remotely sensed chlorophyll-a in Toyama Bay, the Sea of Japan,” J Oceanogr, 70, 175 – 184 (2014).
Updated on April 15, 2019